
All iLive content is medically reviewed or fact checked to ensure as much factual accuracy as possible.
We have strict sourcing guidelines and only link to reputable media sites, academic research institutions and, whenever possible, medically peer reviewed studies. Note that the numbers in parentheses ([1], [2], etc.) are clickable links to these studies.
If you feel that any of our content is inaccurate, out-of-date, or otherwise questionable, please select it and press Ctrl + Enter.
Electrocardiography (ECG)
Medical expert of the article

Last reviewed: 04.07.2025
Electrocardiography is a study that remains unrivaled in its clinical significance. It is usually performed dynamically and is an important indicator of the state of the heart muscle.
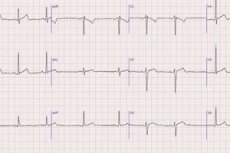
An ECG is a graphical recording of the electrical activity of the heart, which is recorded from the surface of the body. Changes in the electrical activity of the heart are closely related to the summation of electrical processes in individual cardiac myocytes (muscle cells of the heart), the processes of depolarization and repolarization occurring in them.
Purpose of ECG
Determination of electrical activity of the myocardium.
Indications for ECG
A planned examination is performed on all patients hospitalized in an infectious diseases hospital. An unplanned and emergency examination is performed when toxic, inflammatory or ischemic damage to the heart muscle develops or is suspected.
Preparing for an ECG
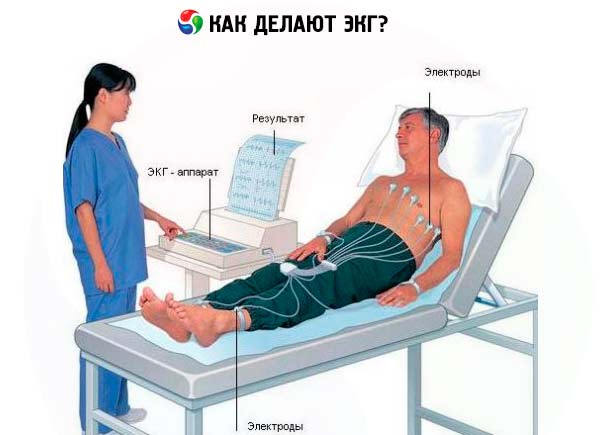
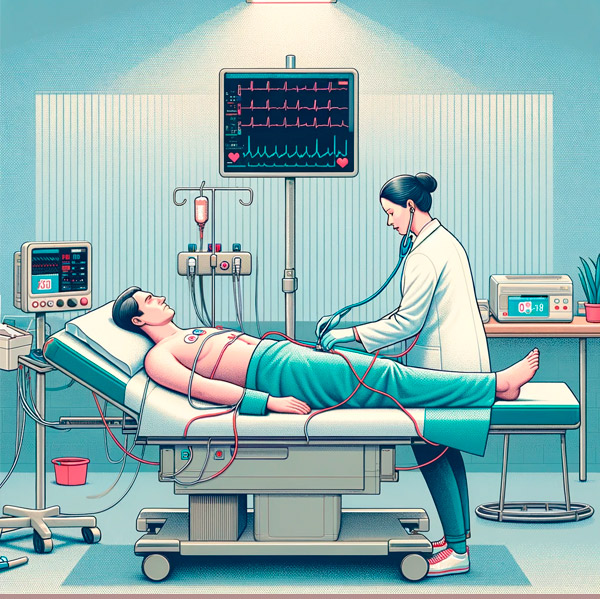
No special preparation is required. The patient is placed on the couch on his back. It is possible to shave the hair in case of abundant hair on the chest of men to ensure full contact of the electrodes with the skin.
Who to contact?
ECG research technique
An electrocardiograph with electronic amplifiers and oscillographs is used. The curves are recorded on a moving paper tape. To record the ECG, potentials are taken from the extremities and the surface of the chest. Three standard leads from the extremities are usually used: Lead I - right arm and left arm, Lead II - right arm and left leg, Lead III - left arm and left leg. To take potentials from the chest, an electrode is applied to one of six points on the chest using the standard method.
Electrophysiological principles of ECG
At rest, the outer surface of the cell membrane is positively charged. A negative charge can be recorded inside the muscle cell using a microelectrode. When the cell is excited, depolarization occurs with the appearance of a negative charge on the surface. After a certain period of excitation, during which a negative charge is maintained on the surface, a change in potential and repolarization occur with the restoration of the negative potential inside the cell. These changes in the action potential are the result of the movement of ions, primarily Na, through the membrane. Na ions first penetrate into the cell, causing a positive charge on the inner surface of the membrane, then it returns to the extracellular space. The depolarization process quickly spreads through the muscle tissue of the heart. During cell excitation, Ca 2+ moves inside the cell, and this is considered a probable link between electrical excitation and subsequent muscle contraction. At the end of the repolarization process, K ions leave the cell, which are ultimately exchanged for Na ions actively extracted from the extracellular space. In this case, a positive charge is again formed on the surface of the cell, which has entered the resting state.
Electrical activity recorded on the body surface by electrodes is the sum (vector) of the depolarization and repolarization processes of numerous cardiac myocytes in amplitude and direction. The excitation, i.e. the depolarization process, of the myocardial sections occurs sequentially, with the help of the so-called cardiac conduction system. There is a kind of excitation wave front that gradually spreads to all sections of the myocardium. On one side of this front, the cell surface is charged negatively, on the other - positively. In this case, changes in the potential on the body surface at various points depend on how this excitation front spreads across the myocardium and which part of the heart muscle is projected to a greater extent onto the corresponding area of the body.
This process of excitation propagation, in which positively and negatively charged areas exist in the tissues, can be represented as a single dipole consisting of two electric fields: one with a positive charge, the other with a negative charge. If the negative charge of the dipole faces the electrode on the body surface, the electrocardiogram curve goes down. When the vector of electric forces changes its direction and its positive charge faces the corresponding electrode on the body surface, the electrocardiogram curve goes in the opposite direction. The direction and magnitude of this vector of electric forces in the myocardium depend primarily on the state of the heart muscle mass, as well as the points from which it is recorded on the body surface. Of greatest importance is the sum of the electric forces arising in the excitation process, resulting in the formation of the so-called QRS complex. It is by these ECG teeth that the direction of the electrical axis of the heart can be assessed, which also has clinical significance. It is clear that in more powerful sections of the myocardium, for example in the left ventricle, the excitation wave spreads for a longer time than in the right ventricle, and this affects the size of the main ECG tooth - the R tooth in the corresponding part of the body onto which this section of the myocardium is projected. When electrically inactive sections consisting of connective tissue or necrotic myocardium are formed in the myocardium, the excitation wave front bends around these sections, and in this case it can be directed to the corresponding section of the body surface either with its positive or negative charge. This entails the rapid appearance of differently directed teeth on the ECG from the corresponding part of the body. When excitation conduction along the conduction system of the heart is disrupted, for example along the right leg of the His bundle, excitation spreads to the right ventricle from the left ventricle. Thus, the excitation wave front, covering the right ventricle, "advances" in a different direction compared to its usual course (i.e., when the excitation wave begins from the right leg of the His bundle). The spread of excitation to the right ventricle occurs at a later time. This is expressed in corresponding changes in the R wave in the leads, onto which the electrical activity of the right ventricle is projected to a greater extent.
The electrical excitation impulse originates in the sinoatrial node, located in the wall of the right atrium. The impulse spreads to the atria, causing their excitation and contraction, and reaches the atrioventricular node. After some delay at this node, the impulse spreads along the bundle of His and its branches to the ventricular myocardium. The electrical activity of the myocardium and its dynamics associated with the spread of excitation and its cessation can be represented as a vector whose amplitude and direction change during the entire cardiac cycle. Moreover, earlier excitation of the subendocardial layers of the ventricular myocardium occurs, followed by the spread of the excitation wave in the direction of the epicardium.
The electrocardiogram reflects the sequential coverage of the myocardial sections by excitation. At a certain speed of the cardiograph tape, the heart rate can be estimated by the intervals between individual complexes, and the duration of individual phases of cardiac activity by the intervals between the teeth. By the voltage, i.e. the amplitude of individual ECG teeth, recorded in certain areas of the body, one can judge the electrical activity of certain sections of the heart and, above all, the size of their muscle mass.
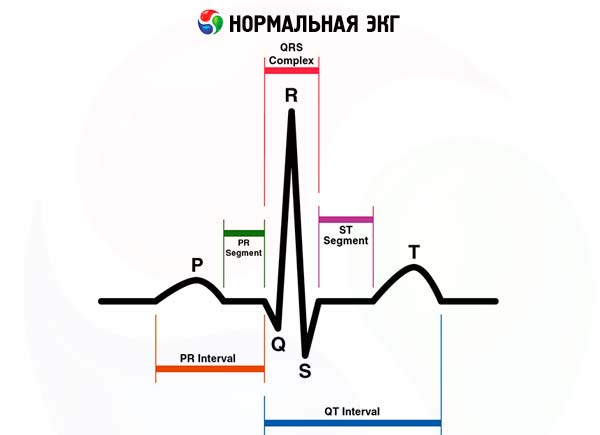
On the ECG, the first wave of small amplitude is called the P wave and reflects depolarization and excitation of the atria. The following high-amplitude QRS complex reflects depolarization and excitation of the ventricles. The first negative wave of the complex is called the Q wave. The next wave is directed upwards, the R wave, and the next negative wave is the S wave. If the 5 wave is followed by another wave directed upwards, it is called the R wave. The shape of this complex and the size of its individual waves will vary significantly when recorded from different parts of the body in the same person. However, it should be remembered that the upward wave is always the R wave, if it is preceded by a negative wave, then it is the Q wave, and the negative wave following it is the S wave. If there is only one downward wave, it should be called the QS wave. To reflect the comparative size of individual waves, the upper and lower case letters rRsS are used.
The QRS complex is followed, after a short period of time, by the T wave, which may be directed upward, i.e. be positive (most often), but may also be negative.
The appearance of this wave reflects the repolarization of the ventricles, i.e. their transition from the excited to the unexcited state. Thus, the QRST (Q-T) complex reflects the electrical systole of the ventricles. It depends on the heart rate and is normally 0.35-0.45 s. Its normal value for the corresponding frequency is determined by a special table.
Of much greater importance is the measurement of two other segments on the ECG. The first is from the beginning of the P wave to the beginning of the QRS complex, i.e. the ventricular complex. This segment corresponds to the time of atrioventricular conduction of excitation and is normally 0.12-0.20 s. If it increases, a violation of atrioventricular conduction is noted. The second segment is the duration of the QRS complex, which corresponds to the time of excitation propagation through the ventricles and is normally less than 0.10 s. If the duration of this complex increases, a violation of intraventricular conduction is noted. Sometimes after the T wave, a positive U wave is noted, the origin of which is associated with repolarization of the conduction system. When registering an ECG, the potential difference between two points of the body is recorded, first of all, this concerns the standard leads from the extremities: lead I - the potential difference between the left and right hands; Lead II - potential difference between the right arm and left leg and Lead III - potential difference between the left leg and left arm. In addition, enhanced leads from the limbs are recorded: aVR, aVL, aVF from the right arm, left arm, left leg, respectively. These are the so-called unipolar leads, in which the second electrode, inactive, is a connection of electrodes from other limbs. Thus, the change in potential is recorded only in the so-called active electrode. In addition, under standard conditions, the ECG is also recorded in 6 chest leads. In this case, the active electrode is placed on the chest at the following points: lead V1 - the fourth intercostal space to the right of the sternum, lead V2 - the fourth intercostal space to the left of the sternum, lead V4 - at the apex of the heart or the fifth intercostal space slightly inward from the midclavicular line, lead V3 - in the middle of the distance between points V2 and V4, lead V5 - the fifth intercostal space along the anterior axillary line, lead V6 - in the fifth intercostal space along the midaxillary line.
The most pronounced electrical activity of the ventricular myocardium is detected during the period of their excitation, i.e. depolarization of their myocardium - during the period of occurrence of the QRS complex. In this case, the resultant of the arising electrical forces of the heart, which is a vector, occupies a certain position in the frontal plane of the body relative to the horizontal zero line. The position of this so-called electrical axis of the heart is estimated by the size of the teeth of the QRS complex in various leads from the extremities. The electrical axis is considered to be undeflected or occupies an intermediate position with a maximum R tooth in leads I, II, III (i.e. the R tooth is significantly larger than the S tooth). The electrical axis of the heart is considered to be deflected to the left or located horizontally if the voltage of the QRS complex and the magnitude of the R wave are maximum in lead I, and in lead III the R wave is minimal with a significant increase in the S wave. The electrical axis of the heart is located vertically or deflected to the right with a maximum R wave in lead III and in the presence of a pronounced S wave in lead I. The position of the electrical axis of the heart depends on extracardiac factors. In people with a high position of the diaphragm, a hypersthenic constitution, the electrical axis of the heart is deflected to the left. In tall, thin people with a low position of the diaphragm, the electrical axis of the heart is normally deflected to the right, located more vertically. Deviation of the electrical axis of the heart can also be associated with pathological processes, predominance of myocardial mass, i.e. hypertrophy of the left ventricle (deviation of the axis to the left) or the right ventricle (deviation of the axis to the right), respectively.
Among the chest leads, V1 and V2 register the potentials of the right ventricle and interventricular septum to a greater extent. Since the right ventricle is relatively weak, the thickness of its myocardium is small (2-3 mm), the spread of excitation along it occurs comparatively quickly. In this regard, in lead V1, a very small R wave is normally registered, followed by a deep and wide S wave, associated with the spread of the excitation wave along the left ventricle. Leads V4-6 are closer to the left ventricle and reflect its potential to a greater extent. Therefore, in leads V4-6, the maximum R wave is registered, especially pronounced in lead V4, i.e. in the region of the apex of the heart, since it is here that the thickness of the myocardium is greatest and, therefore, the spread of the excitation wave requires more time. In these same leads, a small Q wave may also appear, associated with the earlier spread of excitation along the interventricular septum. In the middle precordial leads V2, especially V3, the size of the R and S waves is approximately the same. If in the right chest leads V1-2 the R and S waves are approximately the same, without other deviations from the norm, there is a rotation of the electrical axis of the heart with its deviation to the right. If in the left chest leads the R wave and the S wave are approximately the same, there is a deviation of the electrical axis in the opposite direction. Particular attention should be paid to the shape of the waves in lead aVR. Given the normal position of the heart, the electrode from the right hand is, as it were, turned into the ventricular cavity. In this regard, the shape of the complex in this lead will mirror the normal ECG from the surface of the heart.
When interpreting an ECG, much attention is paid to the state of the isoelectric ST segment and the T wave. In most leads, the T wave should be positive, reaching an amplitude of 2-3 mm. This wave may be negative or smoothed in lead aVR (usually), as well as in leads III and V1. The ST segment is usually isoelectric, i.e. it is at the level of the isoelectric line between the end of the T wave and the beginning of the next P wave. A slight elevation of the ST segment may be in the right chest leads V1-2.
Read also:
 [ 16 ], [ 17 ], [ 18 ], [ 19 ], [ 20 ], [ 21 ], [ 22 ], [ 23 ]