
All iLive content is medically reviewed or fact checked to ensure as much factual accuracy as possible.
We have strict sourcing guidelines and only link to reputable media sites, academic research institutions and, whenever possible, medically peer reviewed studies. Note that the numbers in parentheses ([1], [2], etc.) are clickable links to these studies.
If you feel that any of our content is inaccurate, out-of-date, or otherwise questionable, please select it and press Ctrl + Enter.
ECG for pathology
Medical expert of the article

Last reviewed: 04.07.2025
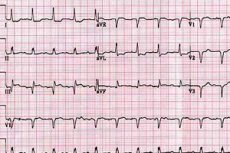
The electrical activity of the atria is assessed by the P wave. This wave is normally positive (directed upward) in most leads (except lead aVR).
Enlargement of the left atrium and its hypertrophy are characterized by the following signs: the P wave increases, widens and becomes jagged in leads I and II (P mitrale).
Who to contact?
ECG after exercise
ECG recording after physical exertion is used to detect changes that are absent at rest. For this purpose, a load is applied on a bicycle ergometer or treadmill (running track). The load is carried out until a submaximal increase in heart rate, the appearance of anginal pain or significant depression of the ST segment, the occurrence of various arrhythmias and conduction disorders. The load is also stopped when signs of circulatory disorders with a decrease in pulse filling, a decrease in arterial pressure appear. The most common, positive reaction to the load, indicating the presence of ischemic changes, is a horizontal or descending depression, less often an increase in the ST segment. The sensitivity of this test is approximately 50% and the specificity is 90%. This means that among patients with stenotic atherosclerosis and myocardial ischemia (in every second patient), this test will be positive. With a positive test with physical exertion, out of 10 patients, 9 have stenotic lesion of the coronary arteries.
A test with physical exertion allows for differential diagnosis of heart pain, confirming or excluding with a high degree of probability their ischemic genesis. The test also allows for evaluation of the functional capabilities of a patient suffering from ischemic heart disease and, in particular, after a myocardial infarction. Rapid, within 6 minutes, appearance of ischemia signs indicates an unfavorable prognosis. In this case, the power developed by the patient and the work performed by him are calculated. Normally, with physical exertion, the heart rate increases, systolic and diastolic pressure increases. On the ECG, the T waves remain positive, and the ST segment in individual leads is subject to only slight depression, but within 1 mm. Pathological changes in the ECG during exercise are characterized by a decrease in the ST segment by more than 1 mm. A pronounced manifestation of pathology can also be rhythm disturbances. In addition to the previously mentioned ischemic symptoms, a gallop rhythm may also appear at the height of physical exertion, as well as a systolic murmur due to papillary muscle dysfunction. The post-exercise ECG has less diagnostic value in patients with pre-existing ST segment changes, left ventricular hypertrophy, and during digoxin treatment. The exercise test should not be performed in unstable angina, during the acute period of myocardial infarction, in severe aortic stenosis, severe hypertension, heart failure, and other serious cardiac lesions, as well as previously proven stenosing coronary sclerosis.
ECG monitoring
Long-term ECG recording ( Holter monitoring ) is used to detect transient rhythm disturbances, in particular to assess the effectiveness of antiarrhythmic therapy, as well as to diagnose myocardial ischemia. The frequency of arrhythmia episodes or extrasystoles and their nature can be assessed quantitatively and compared with clinical manifestations. In this case, the ECG is recorded under conditions of normal physical activity, habitual for the patient. Changes in the ST segment and T wave detected during monitoring are important for diagnosing ischemia, especially when associated with stress.
An indication for ECG monitoring is the presence of symptoms such as palpitations, fainting or pre-fainting conditions, dizziness, indicating the possibility of arrhythmia and in the absence of the latter on the recorded ECG. If the described symptoms occur, and there is no arrhythmia during monitoring, other causes of these manifestations should be sought.
Magnetic recording of the ECG during Holter monitoring is carried out for 6-24 hours. During this time, the subject leads a normal life. Subsequently, the magnetic recording is read on a special device at high speed, and individual sections of this recording can be reproduced on paper.
Decoding the results
The P wave becomes biphasic in lead V1. Enlargement and hypertrophy of the right atrium can be established by the appearance of a high, peaked P wave with an amplitude exceeding 2.5 mm in leads II, III (P pulmonale). Under normal conditions, excitation of the right atrium occurs first, and somewhat later - the left. However, these processes are close in time, and therefore the P wave appears only slightly bifurcated. With hypertrophy of the right atrium, its electrical activity increases, and the excitation processes of both atria seem to be added together, which is expressed in the appearance of a P wave of higher amplitude. With hypertrophy of the left atrium, the component of the P wave associated with it increases in time and amplitude, which is expressed in the appearance of a widened and double-humped P wave in leads I and II.
The P wave may disappear and be replaced by several small waves, which is observed in atrial arrhythmias.
Hypertrophy and enlargement of the ventricles of the heart can be diagnosed by analyzing the ECG, but not always accurately enough. Left ventricular hypertrophy is established by the following signs: the electrical axis of the heart deviates to the left, the amplitude of the R1 + S3 wave is greater than 2.5 mV. RV5 (or RV6) + SV6 is greater than 3.5 mV. Additionally, a decrease in the ST segment in leads I, II and V5,6 is important.
Right ventricular hypertrophy is recognized by the following signs: a tall R wave in the right chest leads and a deep S wave in the left chest leads (the R:S ratio in lead V1 is greater than 1); right axis deviation; a decrease in the ST segment; a negative T wave in the right chest leads.
An increase in the voltage of the QRS complex is possible in young people and is normal.
Intracardiac conduction disorders are diagnosed most reliably by ECG. The PQ interval, reflecting atrioventricular conduction, is extended when it is impaired. In intraventricular conduction disorders associated with damage to the His bundle branches, deformation of the QRS complex and its extension to 0.12 s and higher are observed.
ECG is important for diagnosis and monitoring of patients with ischemic heart disease. The most characteristic sign of myocardial ischemia is horizontal depression (decrease) of 1 mm or lower of the ST segment in leads I, II and chest leads. In typical cases, this is clearly evident during physical exertion. Another sign is the presence of a negative T wave in the same leads, while there may be no depression of the ST segment. However, these changes are, in principle, non-specific, and therefore they should be assessed in combination with clinical data, primarily with the nature of the pain syndrome in the heart.
The appearance of a necrotic focus in the myocardium (myocardial infarction) is accompanied by characteristic changes in the ECG, primarily in those leads that best reflect the electrical activity of the affected area of the heart. At the same time, in the leads that reflect the activity of the myocardial areas located opposite the affected ones (for example, the anterior wall of the left ventricle is opposite to the posterior wall), there are opposite changes, primarily in the ST segment. With a transmural focus, a pronounced Q wave appears, sometimes with a decrease in the R wave and a characteristic rise in the ST segment. When observing the process in dynamics, a gradual return of the ST segment to the isoelectric line with the dynamics of the QRS complex is noted. In anterior wall myocardial infarction, these changes are best seen in the chest leads V4-6, as a decrease in the R wave. In posterior wall left ventricular infarction, they are best seen in the leads that use the left leg electrode, i.e., II, III, and aVF.
Many patients with various cardiac pathologies have non-specific changes in the ST segment and T wave, which must be assessed in comparison with clinical data. Various ECG changes are associated with metabolic disorders, electrolyte balance and the influence of drugs. Hyperkalemia is characterized by a high symmetrical peaked T wave with a narrow base, hypokalemia - by depression of the ST segment, flattening of the T wave, the appearance of a pronounced U wave. Hypercalcemia is expressed in shortening of the QT interval. Long-term treatment with cardiac glycosides can be accompanied by depression of the ST segment, a decrease in the T wave, and shortening of QT. Pronounced repolarization disorders, i.e. ST-T, can occur in cerebral infarction or cerebral hemorrhage.
 [ 9 ]
[ 9 ]